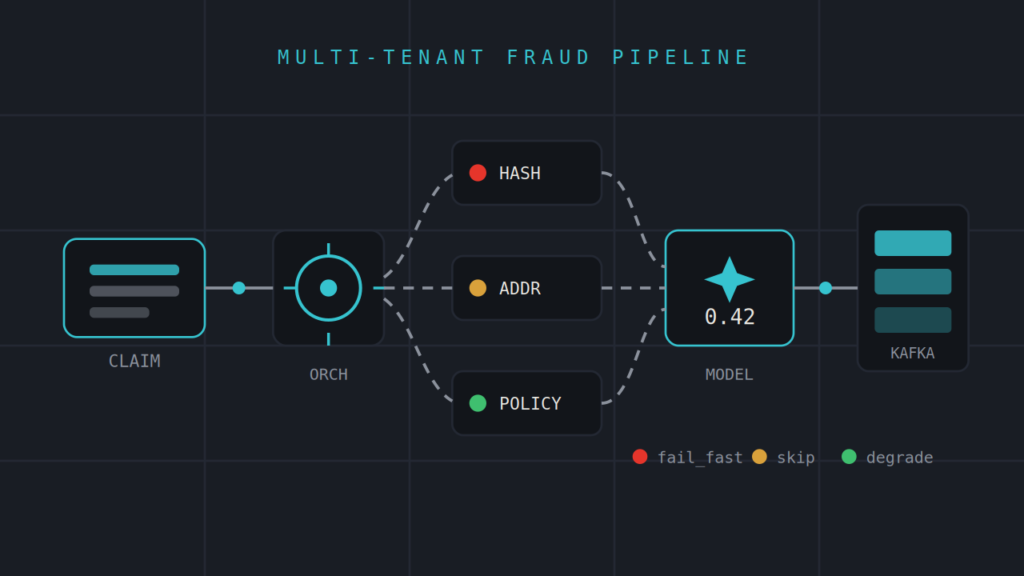
I’m a staff engineer at a large payments company, working on risk and identity — I spend my days on an AI-powered fraud detection platform: DAG-driven orchestration in Go, enrichment services doing address normalization and account-key hashing, a Kafka-backed event pipeline, a model-serving path with a real-time feature store behind it. It’s the kind of system where the interesting design decisions never make it outside the company, because the system itself never does.
So a few weeks ago I sat down and built the same shape of system for a different industry, from scratch, in the open: a multi-tenant insurance-claims fraud platform instead of a payments one. None of the actual code or data is anywhere near proprietary, but it’s the same category of problem — tenant-aware routing, PII that has to be hashed before it goes near a model, a pipeline that has to degrade gracefully instead of falling over. I wanted to be able to point at something public and walk through why it’s built the way it is, not just describe the shape of it in an interview and hope that sounds credible.
The obvious trap with a project like this is starting in the wrong place. The “interesting” parts of a system like this are the tenant-aware DAG engine, the multi-tenancy isolation model, the Kafka topology. So the temptation is to go build those first, because that’s the part you’d put in a design doc’s diagram. I didn’t do that, and I want to talk about why, because the reasoning generalizes past this one project.
Here’s the shape of the thing as it stands today, so the rest of this makes sense with a picture in mind:
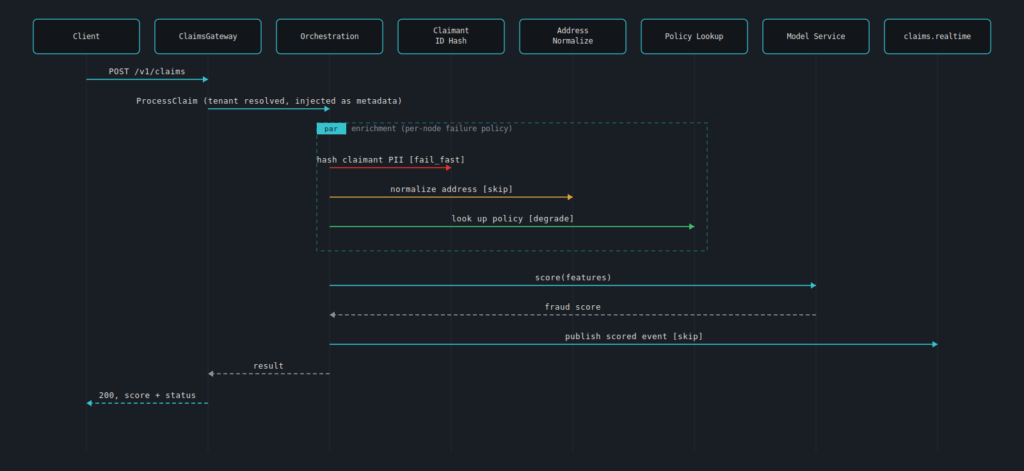
Nothing in that diagram is exotic. The interesting part isn’t the shape, it’s the order I built it in, and what I deliberately left simple at each step — which is what the rest of this is actually about.
Why I didn’t start with the DAG engine
Here’s the thing about building the “hard part” first: you have no consumer for it yet. You’re guessing at the contract. Should the DAG executor support arbitrary dependency graphs, or just a couple of fixed stages? Should config live in Postgres from day one, or a file? You can reason about these questions in the abstract, but you don’t actually know which guesses were wrong until something real calls the thing.
So instead I built a walking skeleton first: a REST endpoint that takes a claim, forwards it over gRPC to an orchestration service, which calls exactly one enrichment service (address normalization — no PII, no encryption, the simplest possible service), which calls a model service that just returns a hardcoded score, which logs a fake Kafka publish. Five services, none of them doing anything clever, wired together for real.
That skeleton is deliberately unimpressive. But it forced every contract question to get answered against something real instead of something imagined:
- How does REST actually become gRPC at the edge?
- How does a Go service call a Java Spring Boot service and get the error handling right?
- What does correlation-id propagation actually look like across that hop?
I hit a real bug almost immediately — a manually-started gRPC server inside a non-web Spring Boot app would log “Started Application” and then just… exit. Turns out Spring Boot’s main thread doesn’t stay alive for a manually-registered gRPC server the way it does for an embedded web server; you need a real non-daemon thread blocking somewhere or the JVM sees nothing left to do and shuts down. That’s a five-minute fix once you know what’s happening, and a genuinely confusing half hour if you don’t. I’d rather hit that on service #1, wired into nothing important yet, than on service #6 with four other things depending on it.
Once the skeleton actually ran end to end, I applied the same idea recursively at every layer after: prove the shape first, defer the expensive infrastructure behind it. That turned into the actual build order —
- Walking skeleton (one real request, five dumb services)
- Tenant Config Service + a config-driven DAG executor, replacing the hardcoded tenant and hardcoded DAG
- The remaining enrichment services (claimant ID hashing, policy lookup)
- A real Kafka publish, replacing the log stub
- A real scoring formula in Model Service, replacing the hardcoded
0.42
Each of those is its own story about what I deliberately didn’t build yet, and why that’s a real decision rather than corner-cutting.
Multi-tenancy: picking “bridge” and meaning it
Before any of that, though, there’s a decision that shapes everything downstream: how do tenants — insurance carriers, in this domain — share (or not share) infrastructure.
There are basically three options:
- Full silo — separate infrastructure per carrier. It’s the safest story for data isolation, and it’s also what a lot of real insurance platforms actually do, for reasons that have more to do with procurement and compliance sign-off than engineering. For a portfolio project it teaches nothing, though — there’s no interesting multi-tenancy logic to write if every tenant just gets their own copy of everything.
- Pure pool — one shared stack, a
tenant_idcolumn everywhere, done. That’s the opposite problem: it under-represents how seriously data segregation actually gets treated in insurance, where “which carrier can see which claimant’s data” isn’t a nice-to-have. - Bridge — a bit of both, depending on what’s actually sensitive. This is the one I went with.
Concretely: shared compute for the stateless stuff — the gateway, orchestration, the enrichment services — routed and behaviorally customized per tenant through config, but genuinely isolated storage and keys for anything sensitive. Per-tenant KMS keys, field-level PII encryption, a data lake partitioned by tenant_id rather than commingled. You get to write real multi-tenancy logic (a DAG that behaves differently per carrier without forking code), without pretending storage isolation doesn’t matter in an industry where it very much does.
The DAG config is where this actually shows up in code, not just in a diagram. Each tenant/product/event-type combination gets its own YAML DAG definition, and any node can carry an enabled_for list to gate it to specific tenants — so a carrier that wants an extra SIU-referral step doesn’t require forking the whole pipeline, just adding one node with enabled_for: [that_carrier]. Shared behavior by default, per-tenant deviation without a code fork. That’s the bridge model, concretely.
What “thin slice” actually meant, service by service
I want to be specific here instead of just asserting “we simplified things,” because the specific simplifications are the actual engineering content.
Claimant ID hashing exists so raw PII (a claimant’s name) never has to travel past the one service that’s supposed to touch it — everything downstream, including the model service and whatever eventually reads off Kafka, only ever sees a hash. The real version of this hashes with a per-tenant key pulled from KMS. I hashed with SHA-256 and one static salt baked into the binary instead. That sounds like cutting a corner, and it is, deliberately — but it proves the actual thing that matters: raw PII genuinely doesn’t reach the model service, and the same claimant hashes identically across submissions so fraud-pattern matching still works. KMS integration is real infrastructure, but it’s a separate concern from whether the hashing behavior is correct, and I didn’t want to build a whole key management integration before I’d even proven the contract needed it.
Policy lookup resolves a policy number against what is, right now, a hardcoded map with one entry in it. There’s no policy-admin system to call. What I did care about was the failure semantics: an unknown policy number is a completely normal, expected outcome — someone submitted a claim against a policy that doesn’t exist in the system, that happens — and it should degrade the response, not blow up the request. That’s an actual design decision (on_failure: degrade), not just “it’s a stub so who cares what it does on failure.”
Which gets at something I like about how the DAG config turned out: every node declares its own failure policy, and that’s not decoration, it’s load-bearing.
- Claimant ID hashing →
fail_fast. Sending a claim downstream without its hash defeats the entire point of hashing it in the first place. - Address normalization →
skip. If it fails, the request continues with the raw address string instead of a normalized one — a fine trade. - Policy lookup →
degrade. An unknown or unreachable policy is a normal, expected outcome, not grounds to kill the request — just flag the response as degraded.
I actually verified this instead of just writing it in YAML and hoping: killed the claimant-hashing service mid-run, confirmed the whole request genuinely fails; restarted it, killed the policy-lookup service instead, confirmed the request comes back 200 with status: "degraded" rather than a hard failure. Watching the exact failure mode you designed for actually happen, on purpose, is a different kind of confidence than reading your own YAML and assuming it’s wired correctly.
Kafka publish is the one I found the most fun to reason about, because “thin slice” here didn’t mean “log it and pretend.” I stood up a real broker (Redpanda, which speaks the Kafka wire protocol without the operational weight of running actual Kafka locally) and a real producer, publishing actual messages to an actual topic, partitioned by tenant. What I didn’t build yet is the full messaging contract from the design doc — Protobuf-encoded messages validated against a schema registry. I’m publishing plain JSON instead. That’s not “the easy version because Protobuf is hard” — it’s that a schema registry is a whole separate piece of infrastructure (register schemas, manage compatibility, wire up serializers) that’s a separate problem from the one I was actually trying to answer: does a scored claim reliably reach the right topic, correctly partitioned, when the pipeline finishes.
Which gets at how I actually verify any of this. Every service here speaks gRPC internally, which is great for the system and miserable for poking at by hand — there’s no curl for gRPC. So alongside the platform itself, I built a small companion tool: a browser console that can parse an arbitrary .proto file, fire a gRPC call at any service, stream a live Kafka topic, and tail a service’s logs, all in one place. I’ve built almost this exact tool once before, professionally — API testing, event streaming, and log tailing unified into one internal dashboard, which is now something other engineers reach for instead of juggling grpcurl, a separate Kafka consumer, and tail -f in three terminals. Building an open version of it here wasn’t optional scope creep; it’s the only reason I could actually watch a scored claim show up on claims.realtime in real time instead of just trusting a log line that says “published.”
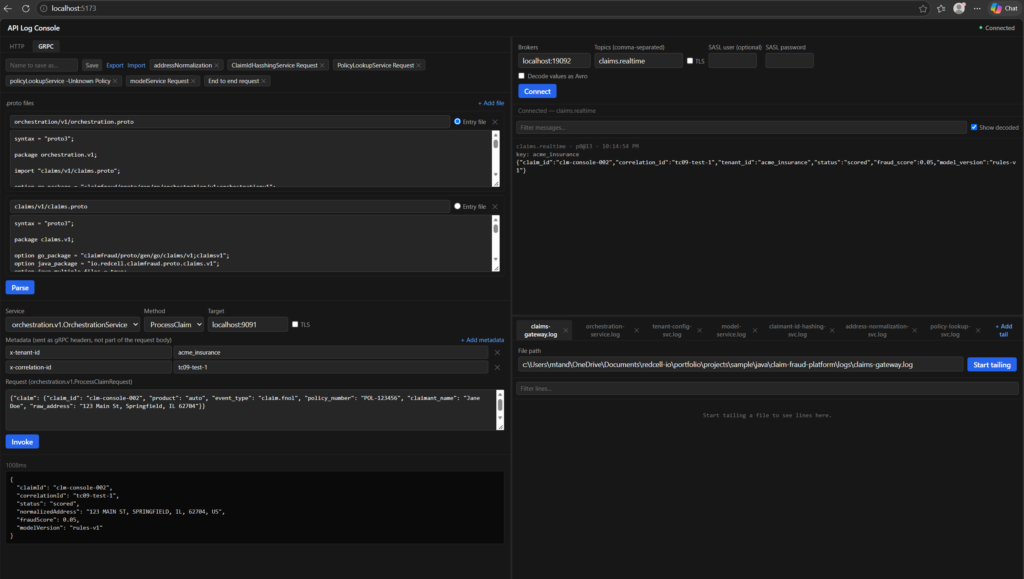
ProcessClaim directly over gRPC, tenant/correlation metadata set by hand. Right: the same request’s output landing on claims.realtime a moment later — the two halves of “does this actually work” in one screen.JSON for the message body has a nice side benefit here too — it just shows up readable in that console without needing Avro or schema-registry decode support. Sometimes the “thin” choice and the “convenient to verify” choice happen to be the same choice.
And then there’s the unglamorous part of building this that never makes it into a design doc but eats real time: port collisions. My address normalization service happens to listen on 9092, which is also Kafka’s conventional default port. Stand up a broker on its default and you’ve just broken a completely unrelated service. I hit a version of this twice — once between two services in this platform, once between this platform and a separate testing tool I built alongside it, where a dev proxy had a port hardcoded and silently broke the moment I moved a backend to a non-default port to dodge the first collision. Neither mistake was hard to fix. Both were the kind of thing that eats twenty minutes of “why is this returning nothing” before you find the actual one-line cause. I’ve started treating “what port does this actually use, and what conventionally claims that port elsewhere” as a real question to ask before wiring up anything new, instead of an afterthought.
Model service started as a hardcoded 0.42 for every single claim, which is exactly as useless as it sounds, but on purpose — the walking skeleton phase wasn’t trying to prove the model was good, it was proving that a score gets computed and returned at all. Once the enrichment services existed for real, I replaced that with an actual formula: a small base score that gets bumped up —
- for a lapsed or cancelled policy
- more for an unknown one
- if the address didn’t validate
Still not machine learning — it’s a hand-weighted rule set, not a trained model — but it’s the first version of this service that actually responds to its inputs instead of returning the same number regardless of what you send it. Submit a claim against a real, active policy with a validated address and it scores low. Submit one against a policy number that doesn’t exist and it visibly scores higher. That’s a meaningfully different kind of “fake” than a hardcoded constant — it’s fake in the sense that it isn’t a trained model yet, not fake in the sense that it ignores its own inputs.
What’s actually next, and why it’s next
The honest next layer isn’t a new enrichment service or another exciting feature — it’s resilience and observability, and I’m doing that before batch processing or a real ML model on purpose. Every DAG node already declares a timeout_ms, but nothing enforces it yet; there’s no retry logic, no circuit breaker. That’s the kind of gap that’s invisible right up until a downstream service gets slow instead of down, and a slow dependency without a timeout is worse than a dead one, because at least a dead one fails fast. Same story for tracing and metrics — I have correlation IDs threading through logs by hand, which is fine for a system with seven processes I personally started this morning, and not remotely fine for anything real. Getting OpenTelemetry tracing and Prometheus metrics in before adding more surface area means every new piece I build after that gets observability by default instead of as a retrofit.
After that:
- The batch flow — reprocessing historical claims through the same enrichment services, on a schedule rather than a live consumer.
- A real ONNX or Triton model behind the scoring service, swapped in behind the exact same gRPC contract the rule-based version already satisfies, so nothing upstream has to change.
- The deferred half of the tenant config layer — Postgres instead of a YAML file, a transactional outbox for cache invalidation instead of “just re-read on every call,” and real API-key resolution instead of a hardcoded tenant ID.
None of that is because the current versions are broken. It’s because each one was a deliberate, named simplification made to prove a narrower thing first, and I wrote down at the time exactly what I was deferring and why. That list is the actual roadmap — not a backlog of vague “technical debt,” but a specific set of decisions I made on purpose, with the reasoning still attached, waiting for their turn.
That’s really the whole point of building this in public: the judgment behind “prove the shape, defer the expensive part, write down why” is the same whether the system in question processes card transactions for a payments network or fake insurance claims on my laptop. I just can’t show you the first one.
The code’s all up at github.com/redcell-io/insurance-claims-fraud-platform if you want to see any of this directly — the commit history roughly tracks the order I’ve described here, and there’s a running decisions log in the repo (DECISIONS.md) that goes into more detail than fits in a single post.